
Numpy库学习—squeeze()函数
numpy.squeeze()函数语法:numpy.squeeze(a,axis = None) 1)a表示输入的数组;2)axis用于指定需要删除的维度,但是指定的维度必须为单维度,否则将会报错;3)axis的取值可为None 或 int 或 tuple of ints, 可选。若axis为空,则删除所有单维度的条目;4)返回值:数组5) 不会修改原数组;作用:从数组的形状中删除
·
numpy.squeeze()函数
语法:numpy.squeeze(a,axis = None)
 1)a表示输入的数组;
 2)axis用于指定需要删除的维度,但是指定的维度必须为单维度,否则将会报错;
 3)axis的取值可为None 或 int 或 tuple of ints, 可选。若axis为空,则删除所有单维度的条目;
 4)返回值:数组
 5) 不会修改原数组;
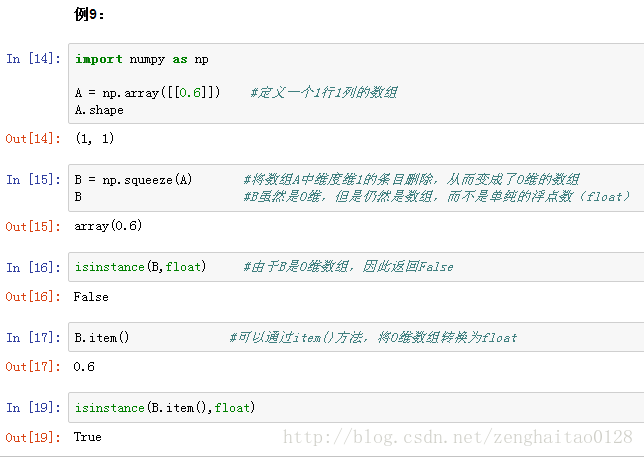
作用:从数组的形状中删除单维度条目,即把shape中为1的维度去掉
引用:https://docs.scipy.org/doc/numpy/reference/generated/numpy.squeeze.html
场景:在机器学习和深度学习中,通常算法的结果是可以表示向量的数组(即包含两对或以上的方括号形式[[]]),如果直接利用这个数组进行画图可能显示界面为空(见后面的示例)。我们可以利用squeeze()函数将表示向量的数组转换为秩为1的数组,这样利用matplotlib库函数画图时,就可以正常的显示结果了。
例1
#例1
import numpy as np

a  = np.arange(10).reshape(1,10)
a
array([[0, 1, 2, 3, 4, 5, 6, 7, 8, 9]])
a.shape(1, 10)
b = np.squeeze(a)
b
array([0, 1, 2, 3, 4, 5, 6, 7, 8, 9])
b.shape(10,)
例2
#例2
c  = np.arange(10).reshape(2,5)
c
array([[0, 1, 2, 3, 4],
[5, 6, 7, 8, 9]])
np.squeeze(c)array([[0, 1, 2, 3, 4],
[5, 6, 7, 8, 9]])
例3
#例3
d  = np.arange(10).reshape(1,2,5)
d
array([[[0, 1, 2, 3, 4],
[5, 6, 7, 8, 9]]])
d.shape(1, 2, 5)
np.squeeze(d)array([[0, 1, 2, 3, 4],
[5, 6, 7, 8, 9]])
np.squeeze(d).shape(2, 5)
结论:根据上述例1~3可知,np.squeeze()函数可以删除数组形状中的单维度条目,即把shape中为1的维度去掉,但是对非单维的维度不起作用。
例4
#例4
e  = np.arange(10).reshape(1,10,1)
e
array([[[0],
[1],
[2],
[3],
[4],
[5],
[6],
[7],
[8],
[9]]])
np.squeeze(e)array([0, 1, 2, 3, 4, 5, 6, 7, 8, 9])
np.squeeze(e).shape(10,)
例5
np.squeeze(e,axis = 0)array([[0],
[1],
[2],
[3],
[4],
[5],
[6],
[7],
[8],
[9]])
np.squeeze(e,axis = 0).shape(10, 1)
例6
#例6
np.squeeze(e,axis = 2)
array([[0, 1, 2, 3, 4, 5, 6, 7, 8, 9]])
np.squeeze(e,axis = 2).shape(1, 10)
例7
#例7,指定的维度不是单维,因此会报错
np.squeeze(e,axis = 1)
---------------------------------------------------------------------------
ValueError Traceback (most recent call last)
<ipython-input-52-75477f85aa4c> in <module>()
1 #例7,指定的维度不是单维,因此会报错
----> 2 np.squeeze(e,axis = 1)
D:\Anaconda3\lib\site-packages\numpy\core\fromnumeric.py in squeeze(a, axis)
1196 try:
1197 # First try to use the new axis= parameter
-> 1198 return squeeze(axis=axis)
1199 except TypeError:
1200 # For backwards compatibility
ValueError: cannot select an axis to squeeze out which has size not equal to one
例8:matplotlib画图示例
import matplotlib.pyplot as plt
import numpy as np
%matplotlib inline
#无法正常显示图示案例
squares =np.array([[1,4,9,16,25]])
squares.shape #要显示的数组为可表示1行5列的向量的数组(1, 5)
plt.plot(squares)
plt.show()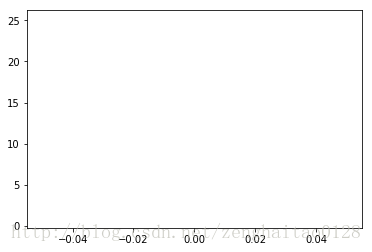
#正常显示图示案例
#通过np.squeeze()函数转换后,要显示的数组变成了秩为1的数组,即(5,)
plt.plot(np.squeeze(squares))
plt.show()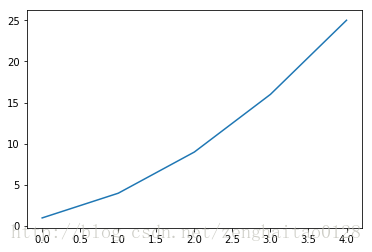
np.squeeze(squares).shape(5,)

学大模型,用大模型上飞桨星河社区!每天8点V100G算力免费领!免费领取ERNIE 4.0 100w Token >>>
更多推荐

 264
264 0
0- 0


 已为社区贡献1条内容

所有评论(0)