
MNIST的小众兄弟? —— Kannada MNIST数据集的可视化及分类
卡纳达语是印度西南部卡纳塔克邦人主要使用的一种语言。大约有4500万人以这种语言为母语,使用坎那达语书写。Kannada MNIST数据集是为我们所熟悉的经典MNIST提供一个简单的扩展。它使用的不是阿拉伯数字,而是Kannada数字数据集。这个数据集在“Kannada-MNIST: A new handwritten digits dataset for the Kannada language
Kannada MNIST
卡纳达语是印度西南部卡纳塔克邦人主要使用的一种语言。大约有4500万人以这种语言为母语,使用坎那达语书写。
Kannada MNIST数据集是为我们所熟悉的经典MNIST提供一个简单的扩展。它使用的不是阿拉伯数字,而是Kannada数字数据集。这个数据集在“Kannada-MNIST: A new handwritten digits dataset for the Kannada language”中有详细的介绍。

在这个项目中,我们将使用PCA,t-SNE,UMAP对其进行可视化,并使用多种机器学习和深度学习方法分类。
!pip install -qq umap-learn==0.4.6
!pip install -qq catboost
import paddle
import paddle.nn as nn
from paddle.io import Dataset, DataLoader

from sklearn import svm
from sklearn.manifold import TSNE
from sklearn.decomposition import PCA
from sklearn.metrics import accuracy_score
from sklearn.linear_model import LogisticRegression
from sklearn.model_selection import train_test_split
from sklearn.metrics import classification_report,confusion_matrix

import umap
import time
import numpy as np
import pandas as pd
import seaborn as sns
from scipy import stats
import matplotlib.pyplot as plt
from xgboost import XGBClassifier
from catboost import CatBoostClassifier

import warnings
warnings.filterwarnings("ignore")
1. 数据集
train.csv,Dig-MNIST.csv和test.csv包含Kannada MNIST手绘数字的灰度图像。每个图像的高度为28像素,宽度为28像素,总共为784像素。每个像素都有一个相关的像素值。该像素值是一个0到255之间的整数。其中test.csv仅供测试,不包含图像对应的标签。
需要注意的是,Dig-MNIST.csv是额外的手写数据集(有10k张图片)。它是在志愿者的帮助下创建的,这些志愿者都不是以Kannada作为母语的人。与主数据集相比,他们写在一个更小的表格上,使用不同参数的扫描仪。这意味着“dig-MNIST”数据集可以作为一个更困难的测试集(在上面引用的论文中报告了76.1%的准确率)。
1.1. 读入数据
上面提到了Dig-MNIST.csv和train.csv中图片的不同,这点从下面代码的输出可以清楚的看出。为了方便操作,该项目直接将dig和train当成一整个数据集对待。
# 解压数据集
!unzip -qoa data/data157747/Kannada-MNIST.zip -d data
# 读入csv
df_train = pd.read_csv('data/train.csv')
df_val = pd.read_csv('data/Dig-MNIST.csv')
print(f"train.csv size is {df_train.shape}")
print(f"val_data size is {df_val.shape}")
train.csv size is (60000, 785)
val_data size is (10240, 785)
def show_imgs(x_train, y_train, rows=3):
    classes = ["0", "1", "2", "3", "4", "5", "6", "7", "8", "9"]
    for y, cls in enumerate(classes):
        idxs = np.nonzero([i == y for i in y_train])
        idxs = np.random.choice(idxs[0], rows)
        for i , idx in enumerate(idxs):
            plt_idx = i * len(classes) + y + 1
            plt.subplot(rows, len(classes), plt_idx)
            plt.imshow(x_train.iloc[idx].values.reshape((28,28)), cmap='gray')
            plt.axis("off")
            if i == 0:
                plt.title(cls)
    plt.show()
# train.csv
show_imgs(df_train.iloc[:,1:], df_train.iloc[:,0], rows=4)

# Dig-MNIST.csv
show_imgs(df_val.iloc[:,1:], df_val.iloc[:,0], rows=4)

1.2. 数据集可视化
很多机器学习问题都包含成百上千的特征。拥有如此多的特性主要会带来某些问题,例如:难以得到好的模型,训练速度慢。
在这个部分,我们利用三种常见的方法对数据降维,并对比使用不同方法降维后的可视化效果。
x = df_train.iloc[:,1:]
y = df_train.iloc[:,0]
1.2.1. PCA
PCA是一种非常常见的降维技术。它背后的想法非常简单:识别离数据最近的超平面,将数据投射到超平面上。这种方法使我们有可能在二维中看到数字的布局。这里要注意的另一个重要的事情是,我们以无监督的方式实现了这一目标,即没有标签。
下面的可视化图显示出,尽管PCA能够保存一些信息,但是它无法清晰的分离不同的数字。这是因为PCA是一个线性投影,这意味着它不能捕捉非线性依赖关系。
pca = PCA(n_components=2) # project from 784 to 2 dimensions
principalComponents = pca.fit_transform(x)

plt.scatter(principalComponents[:, 0], principalComponents[:, 1], s=5, c=y, cmap='Spectral')
plt.gca().set_aspect('equal', 'datalim')
plt.colorbar(boundaries=np.arange(11)-0.5).set_ticks(np.arange(10))
plt.title('Visualizing Kannada MNIST through PCA', fontsize=18)
Text(0.5,1,'Visualizing Kannada MNIST through PCA')

1.2.2. t-SNE
为了得到更好的可视化效果,我们使用t-SNE来缓解上面提到的PCA的不足之处。t-SNE在降低维度的同时试图保持相似实例的接近和不同实例的分离。
但t-SNE也是有缺点的。第一是非常耗时间,可以先利用pca降到合适的维度,再用t-SNE继续降维。第二是,t-SNE适合做可视化,但不适合当作预处理的方法。
pca_50 = PCA(n_components=50)
pca_result_50 = pca_50.fit_transform(x)
tsne = TSNE(random_state = 42, n_components=2, verbose=0, perplexity=40, n_iter=300).fit_transform(pca_result_50)

plt.scatter(tsne[:, 0], tsne[:, 1], s=5, c=y, cmap='Spectral')
plt.gca().set_aspect('equal', 'datalim')
plt.colorbar(boundaries=np.arange(11)-0.5).set_ticks(np.arange(10))
plt.title('Visualizing Kannada MNIST through t-SNE', fontsize=18)
Text(0.5,1,'Visualizing Kannada MNIST through t-SNE')

1.2.3. UMAP
相比于t-SNE,UMAP有以下几点好处:
- 速度快
- 更好的捕获数据的全局结构
- UMAP也可以用于预处理
reducer = umap.UMAP(random_state=42)
embedding = reducer.fit_transform(x)

plt.scatter(reducer.embedding_[:, 0], reducer.embedding_[:, 1], s=5, c=y, cmap='Spectral')
plt.gca().set_aspect('equal', 'datalim')
plt.colorbar(boundaries=np.arange(11)-0.5).set_ticks(np.arange(10))
plt.title('Visualizing Kannada MNIST with UMAP', fontsize=18)
Text(0.5,1,'Visualizing Kannada MNIST with UMAP')

1.3. 分割数据集
将数据集预处理后分成 8:1:1。
def one_hot(labels,Label_class):
    one_hot_label = np.array([[int(i == int(labels[j])) for i in range(Label_class)] for j in range(len(labels))])
    return one_hot_label

def data_prep(raw):
    # label转换成one-hot
    out_y = one_hot(raw.label, num_classes)
    # 将像素值reshape成image的形状
    num_images = raw.shape[0]
    x_as_array = raw.values[:,1:]
    x_shaped_array = x_as_array.reshape(num_images, img_rows, img_cols, 1)
    # normalization
    out_x = x_shaped_array / 255
    return out_x, out_y
img_rows, img_cols = 28, 28
num_classes = 10

x_train, y_train = data_prep(df_train)
x_val, y_val = data_prep(df_val)

x_train, x_test, y_train, y_test = train_test_split(np.concatenate((x_train, x_val)),
                                                        np.concatenate((y_train, y_val)),
                                                        test_size=0.2, shuffle=True,
                                                        random_state=42, stratify=np.concatenate((y_train, y_val)))
x_val, x_test, y_val, y_test = train_test_split(x_test, y_test,
                                                test_size=0.5, shuffle=True,
                                                random_state=42, stratify=y_test)

print(f"Training data size is {x_train.shape}")
print(f"Training data size is {y_train.shape}")
print(f"Validation data size is {x_val.shape}")
print(f"Validation data size is {y_val.shape}")
print(f"Testing data size is {x_test.shape}")
print(f"Testing data size is {y_test.shape}")
Training data size is (56192, 28, 28, 1)
Training data size is (56192, 10)
Validation data size is (7024, 28, 28, 1)
Validation data size is (7024, 10)
Testing data size is (7024, 28, 28, 1)
Testing data size is (7024, 10)
1.4. Dataloader
这一部分是为最后CNN做准备,组建dataloader
class KannadaDataset(Dataset):
    """
    步骤一:继承 paddle.io.Dataset 类
    """
    def __init__(self, data_x, data_y):
        """
        步骤二:实现 __init__ 函数,初始化数据集,将样本和标签映射到列表中
        """
        super(KannadaDataset, self).__init__()
        self.data_x = data_x
        self.data_y = data_y

    def __getitem__(self, index):
        """
        步骤三:实现 __getitem__ 函数,定义指定 index 时如何获取数据,并返回单条数据(样本数据、对应的标签)
        """
        image = np.array(self.data_x[index].reshape(1, 28, 28)).astype('float32')
        label = np.array(self.data_y[index]).astype('float32')
        return image, label

    def __len__(self):
        """
        步骤四:实现 __len__ 函数,返回数据集的样本总数
        """
        return len(self.data_y)
# 将数据转为paddle.io.Dataset类型
train_dataset = KannadaDataset(x_train, y_train)
val_dataset = KannadaDataset(x_val, y_val)
test_dataset = KannadaDataset(x_test, y_test)
# 实例化数据读取器
train_loader = DataLoader(
    train_dataset,
    batch_size=256,
    shuffle=True,
    drop_last=False,
    num_workers=4
)
val_loader = DataLoader(
    val_dataset,
    batch_size=512,
    shuffle=False,
    drop_last=False,
    num_workers=4
)
test_loader = DataLoader(
    test_dataset,
    batch_size=512,
    shuffle=False,
    drop_last=False,
    num_workers=4
)
2. 分类器
在这个小节中,我们将使用不同的方法对Kannada手写数字进行分类。打印出每个分类器结果的confusion matrix,并记录训练和推理时间以及准确率。
2.1. Logistic Regression
逻辑回归是一种广义的线性回归分析模型,它解决的是分类问题。
LR_x_train = x_train.reshape(x_train.shape[0],-1)
LR_x_test = x_test.reshape(x_test.shape[0],-1)
LR_model = LogisticRegression(C=5, solver='lbfgs', multi_class='multinomial')

LR_start = time.perf_counter()
_ = LR_model.fit(LR_x_train, y_train.argmax(axis=1))
LR_end = time.perf_counter()
LR_time = LR_end - LR_start
LR_start = time.perf_counter()
y_pred_LR = LR_model.predict(LR_x_test)
LR_end = time.perf_counter()
LR_infer = LR_end - LR_start
LR_acc = accuracy_score(y_pred_LR, y_test.argmax(axis=1))
print('accuracy is', LR_acc)
accuracy is 0.9353644646924829
print(classification_report(y_test.argmax(axis=1), y_pred_LR))
              precision    recall  f1-score   support

           0       0.94      0.92      0.93       702
           1       0.94      0.96      0.95       702
           2       0.97      0.95      0.96       703
           3       0.92      0.92      0.92       702
           4       0.94      0.96      0.95       703
           5       0.94      0.93      0.94       703
           6       0.89      0.92      0.91       703
           7       0.89      0.89      0.89       702
           8       0.97      0.96      0.96       702
           9       0.96      0.94      0.95       702

    accuracy                           0.94      7024
   macro avg       0.94      0.94      0.94      7024
weighted avg       0.94      0.94      0.94      7024
matrix_LR = confusion_matrix(y_test.argmax(axis=1), y_pred_LR)
sns.heatmap(matrix_LR, annot=True, fmt='.0f')
plt.title('Confusion Matrix for Kannada MNIST\n Recognizer Using Logistic Regression')
plt.xlabel('Predicted class')
plt.ylabel('True class')
plt.show()

2.2. PCA SVM
第二种测试的方法是SVM。我们对数据降维后再输入SVM。
svm_x_train = x_train.reshape(x_train.shape[0],-1)
svm_x_test = x_test.reshape(x_test.shape[0],-1)
pca = PCA(n_components=0.7,whiten=True)
x_train_PCA = pca.fit_transform(svm_x_train)
x_test_PCA = pca.transform(svm_x_test)
svc_model = svm.SVC(kernel='rbf',C=9)

sv_start = time.perf_counter()
_ = svc_model.fit(x_train_PCA, y_train.argmax(axis=1))
sv_end = time.perf_counter()
sv_time = sv_end - sv_start
sv_start = time.perf_counter()
y_pred_sv = svc_model.predict(x_test_PCA)
sv_end = time.perf_counter()
sv_infer = sv_end - sv_start
sv_acc = accuracy_score(y_pred_sv, y_test.argmax(axis=1))
print('accuracy is', sv_acc)
accuracy is 0.9792141230068337
print(classification_report(y_test.argmax(axis=1), y_pred_sv))
              precision    recall  f1-score   support

           0       0.97      0.97      0.97       702
           1       0.97      0.98      0.98       702
           2       0.99      0.98      0.99       703
           3       0.98      0.97      0.98       702
           4       0.99      0.99      0.99       703
           5       0.99      0.99      0.99       703
           6       0.95      0.97      0.96       703
           7       0.96      0.97      0.97       702
           8       0.99      0.99      0.99       702
           9       0.99      0.98      0.99       702

    accuracy                           0.98      7024
   macro avg       0.98      0.98      0.98      7024
weighted avg       0.98      0.98      0.98      7024
matrix_sv = confusion_matrix(y_test.argmax(axis=1), y_pred_sv)
sns.heatmap(matrix_sv, annot=True, fmt='.0f')
plt.title('Confusion Matrix for Kannada MNIST\n Recognizer Using SVM with PCA')
plt.xlabel('Predicted class')
plt.ylabel('True class')
plt.show()

2.3. XGBOOST
XGBoost(eXtreme Gradient Boosting)是基于Boosting框架的一个算法工具包(包括工程实现),在并行计算效率、缺失值处理、预测性能上都非常强大。详细信息参考以下链接:
- https://www.nvidia.cn/glossary/data-science/xgboost/
- https://zhuanlan.zhihu.com/p/142413825
xg_x_train = x_train.reshape(x_train.shape[0],-1)
xg_x_test = x_test.reshape(x_test.shape[0],-1)
xgboost_model = XGBClassifier(tree_method='gpu_hist', eval_metric='mlogloss', use_label_encoder =False)
xg_start = time.perf_counter()
_ = xgboost_model.fit(xg_x_train, y_train.argmax(axis=1))
xg_end = time.perf_counter()
xg_time = xg_end - xg_start
xg_start = time.perf_counter()
y_pred_xg = xgboost_model.predict(xg_x_test)
xg_end = time.perf_counter()
xg_infer = xg_end - xg_start
xg_acc = accuracy_score(y_pred_xg, y_test.argmax(axis=1))
print('accuracy is', xg_acc)
accuracy is 0.9715261958997722
print(classification_report(y_test.argmax(axis=1), y_pred_xg))
              precision    recall  f1-score   support

           0       0.97      0.96      0.97       702
           1       0.97      0.99      0.98       702
           2       0.99      0.98      0.99       703
           3       0.97      0.96      0.96       702
           4       0.98      0.99      0.98       703
           5       0.99      0.97      0.98       703
           6       0.95      0.96      0.95       703
           7       0.95      0.97      0.96       702
           8       0.97      0.98      0.98       702
           9       0.98      0.97      0.97       702

    accuracy                           0.97      7024
   macro avg       0.97      0.97      0.97      7024
weighted avg       0.97      0.97      0.97      7024
matrix_xg = confusion_matrix(y_test.argmax(axis=1), y_pred_xg)
sns.heatmap(matrix_xg, annot=True, fmt='.0f')
plt.title('Confusion Matrix for Kannada MNIST\n Recognizer Using XGBoost')
plt.xlabel('Predicted class')
plt.ylabel('True class')
plt.show()

2.4. CatBoost
使用catboost时,只需少量的预处理即可获得一个高准确率的模型。
参考:
- https://zhuanlan.zhihu.com/p/475432922
- https://blog.csdn.net/weixin_49708196/article/details/124018649
cat_x_train = x_train.reshape(x_train.shape[0],-1)
cat_x_test = x_test.reshape(x_test.shape[0],-1)
catboost_model = CatBoostClassifier(task_type="GPU")
cat_start = time.perf_counter()
_ = catboost_model.fit(cat_x_train, y_train.argmax(axis=1), verbose=0)
cat_end = time.perf_counter()
cat_time = cat_end - cat_start
cat_start = time.perf_counter()
y_pred_cat = catboost_model.predict(cat_x_test).reshape(-1)
cat_end = time.perf_counter()
cat_infer = cat_end - cat_start
cat_acc = accuracy_score(y_pred_cat, y_test.argmax(axis=1))
print('accuracy is', cat_acc)
accuracy is 0.9665432801822323
print(classification_report(y_test.argmax(axis=1), y_pred_cat))
              precision    recall  f1-score   support

           0       0.96      0.95      0.96       702
           1       0.96      0.98      0.97       702
           2       0.99      0.98      0.98       703
           3       0.96      0.94      0.95       702
           4       0.97      0.98      0.97       703
           5       0.97      0.97      0.97       703
           6       0.95      0.96      0.95       703
           7       0.94      0.95      0.95       702
           8       0.98      0.98      0.98       702
           9       0.98      0.97      0.97       702

    accuracy                           0.97      7024
   macro avg       0.97      0.97      0.97      7024
weighted avg       0.97      0.97      0.97      7024
matrix_cat = confusion_matrix(y_test.argmax(axis=1), y_pred_cat)
sns.heatmap(matrix_cat, annot=True, fmt='.0f')
plt.title('Confusion Matrix for Kannada MNIST\n Recognizer Using CatBoost')
plt.xlabel('Predicted class')
plt.ylabel('True class')
plt.show()

2.5. CNN
对于这种简单的任务,我们只需简单的CNN训练几个epoch就能达到很好的效果。想要改进可以加入数据增广,但是需要小心,Kannada MNIST中的数字有些经过旋转后就是另外一个数字了。
cnn_net = nn.Sequential(
    nn.Conv2D(1, 32, 3, padding='SAME'),
    nn.ReLU(), nn.BatchNorm(32),
    nn.Conv2D(32, 32, 3, padding='SAME'),
    nn.ReLU(), nn.BatchNorm(32),

    nn.Conv2D(32, 64, 3, padding='SAME'),
    nn.ReLU(), nn.BatchNorm(64),
    nn.Conv2D(64, 64, 3, padding='SAME'),
    nn.ReLU(), nn.BatchNorm(64),

    nn.Conv2D(64, 128, 3, padding='SAME'),
    nn.ReLU(), nn.BatchNorm(128),
    nn.Conv2D(128, 128, 3, padding='SAME'),
    nn.ReLU(), nn.BatchNorm(128),

    nn.AdaptiveAvgPool2D((1,1)),
    nn.Flatten(), nn.Dropout(0.3),
    nn.Linear(128, 10),
    nn.Softmax()
)
cnn_model = paddle.Model(cnn_net)
cnn_model.prepare(
optimizer=paddle.optimizer.Adam(learning_rate=0.002, parameters=cnn_model.parameters()),
loss=nn.CrossEntropyLoss(soft_label=True),
metrics=paddle.metric.Accuracy()
)
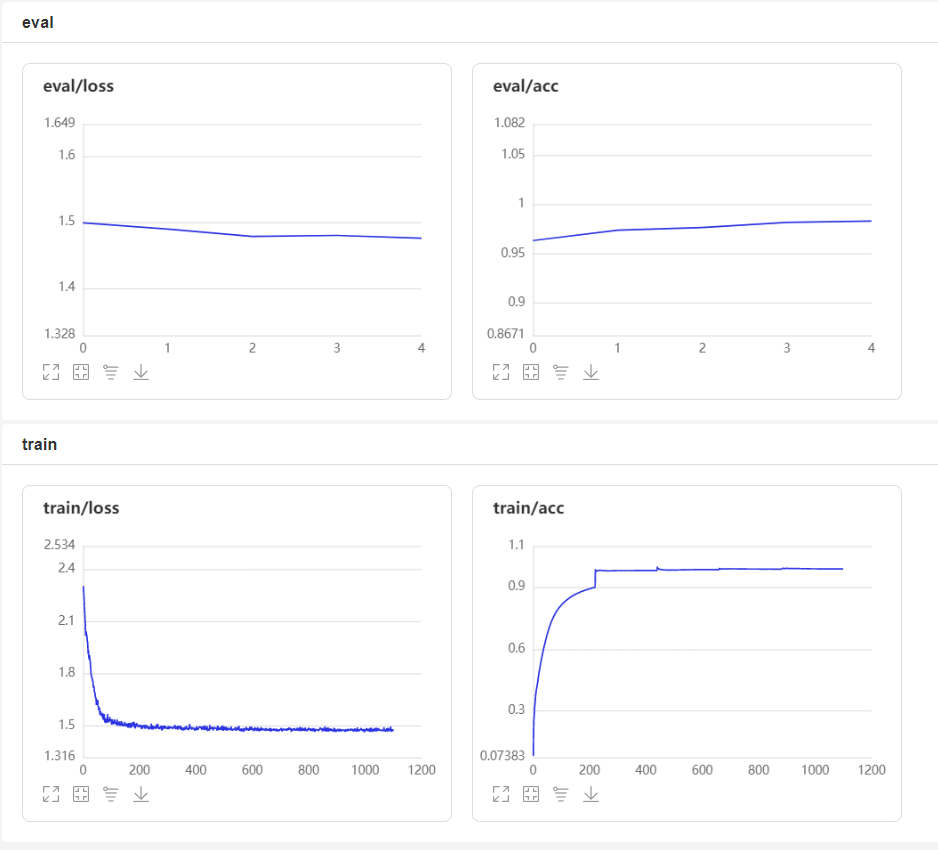
callback = paddle.callbacks.VisualDL(log_dir='visualdl_log_dir')
cnn_start = time.perf_counter()
cnn_model.fit(train_loader, val_loader, epochs=5, verbose=0, callbacks=callback)
cnn_end = time.perf_counter()
cnn_time = cnn_end - cnn_start
cnn_start = time.perf_counter()
y_pred_cnn = np.array(cnn_model.predict(test_dataset, batch_size=256, stack_outputs=True, verbose=0))[0].argmax(axis=-1)
cnn_end = time.perf_counter()
cnn_infer = cnn_end - cnn_start
cnn_acc = accuracy_score(y_pred_cnn, y_test.argmax(axis=1))
print('accuracy is', cnn_acc)
accuracy is 0.984624145785877
print(classification_report(y_test.argmax(axis=1), y_pred_cnn))
              precision    recall  f1-score   support

           0       0.99      0.97      0.98       702
           1       0.95      1.00      0.97       702
           2       0.99      0.99      0.99       703
           3       0.99      0.97      0.98       702
           4       1.00      0.98      0.99       703
           5       0.99      0.99      0.99       703
           6       0.98      0.98      0.98       703
           7       0.98      0.99      0.98       702
           8       0.99      1.00      0.99       702
           9       0.99      0.98      0.99       702

    accuracy                           0.98      7024
   macro avg       0.98      0.98      0.98      7024
weighted avg       0.98      0.98      0.98      7024
matrix_cnn = confusion_matrix(y_test.argmax(axis=1), y_pred_cnn)
sns.heatmap(matrix_cnn, annot=True, fmt='.0f')
plt.title('Confusion Matrix for Kannada MNIST\n Recognizer Using CNN')
plt.xlabel('Predicted class')
plt.ylabel('True class')
plt.show()

2.6. 硬投票集成
最后尝试将上面几个模型集成,由于有些模型输出每个分类的概率会使结果不同,这里采用硬投票的方法。
ensemble_time = LR_time + sv_time + xg_time + cat_time + cnn_time

ensemble_start = time.perf_counter()
y_pred_ensemble = stats.mode(np.concatenate(([y_pred_LR], [y_pred_sv], [y_pred_xg], [y_pred_cat], [y_pred_cnn]), axis=0).T, axis=1)[0].reshape(-1)
ensemble_end = time.perf_counter()
ensemble_infer = ensemble_end - ensemble_start + LR_infer + sv_infer + xg_infer + cat_infer + cnn_infer
ensemble_acc = accuracy_score(y_pred_ensemble, y_test.argmax(axis=1))
print('accuracy is', ensemble_acc)
accuracy is 0.9770785876993167
print(classification_report(y_test.argmax(axis=1), y_pred_ensemble))
              precision    recall  f1-score   support

           0       0.97      0.96      0.97       702
           1       0.97      0.99      0.98       702
           2       0.99      0.98      0.99       703
           3       0.98      0.96      0.97       702
           4       0.98      0.99      0.99       703
           5       0.99      0.98      0.99       703
           6       0.96      0.98      0.97       703
           7       0.96      0.97      0.97       702
           8       0.99      0.98      0.99       702
           9       0.99      0.97      0.98       702

    accuracy                           0.98      7024
   macro avg       0.98      0.98      0.98      7024
weighted avg       0.98      0.98      0.98      7024
matrix_ensemble = confusion_matrix(y_test.argmax(axis=1), y_pred_ensemble)
sns.heatmap(matrix_ensemble, annot=True, fmt='.0f')
plt.title('Confusion Matrix for Kannada MNIST\n Recognizer Using Ensemble Method')
plt.xlabel('Predicted class')
plt.ylabel('True class')
plt.show()

3. 总结
在这里,我们对上面记录的结果进行比较。XGBOOST和CatBoost可以在非常短的时间内训练出高精度的模型,想要更高的精度可以使用CNN。可以看出对于简单的问题,深度学习的优势并不明显,且需要更长的训练时间。另外,无脑的硬投票集成并不能得到更好的模型。项目最后的badcase可以看出,由于Dig-MNIST.csv中书写和扫描的差异,部分数据质量并不是很好。这让进一步提升精度变得困难。
总的来说,Kannada MNIST和经典MNIST并无太大差异。但细节上,若使用在MNIST上预训练的CNN,我们需要注意例如Kannada中3和7的字形与MNIST中2的字形非常相似。
# 时间和准确度对比
model_compare = pd.DataFrame({
    'Model': ['Logistic Regression', 'PCA SVM', 'XGBOOST', 'CatBoost', 'CNN', 'Hard Ensemble'],
    'Score': [LR_acc, sv_acc, xg_acc, cat_acc, cnn_acc, ensemble_acc],
    'Training Time(s)': [LR_time, sv_time, xg_time, cat_time, cnn_time, ensemble_time],
    'Infer Time(s)': [LR_infer, sv_infer, xg_infer, cat_infer, cnn_infer, ensemble_infer]
    })
print(model_compare.round(4))
                 Model   Score  Training Time(s)  Infer Time(s)
0  Logistic Regression  0.9354           52.6751         0.0954
1              PCA SVM  0.9792           65.4783        16.2274
2              XGBOOST  0.9715           22.2845         0.1083
3             CatBoost  0.9665           27.1152         2.0404
4                  CNN  0.9846           42.2063         0.2540
5        Hard Ensemble  0.9771          209.7593        18.8918
# 可视化集成模型中的badcase
pred_judge = (y_pred_ensemble!=y_test.argmax(axis=1))
fig = plt.figure(figsize=(9,9))
ax = []
for i in range(9):
    ax.append(fig.add_subplot(3,3,i+1))
    ax[i].imshow(x_test[pred_judge][i].reshape(28,28), cmap='gray')
    ax[i].set_title(f'True: {y_test.argmax(axis=1)[pred_judge][i]}'+f'   Pred: {y_pred_ensemble[pred_judge][i]}')
    ax[i].axis("off")
plt.show()

我在AI Studio上获得钻石等级,点亮7个徽章,来互关呀~
https://aistudio.baidu.com/aistudio/personalcenter/thirdview/815060
转载自:https://aistudio.baidu.com/aistudio/projectdetail/4335453

学大模型,用大模型上飞桨星河社区!每天8点V100G算力免费领!免费领取ERNIE 4.0 100w Token >>>
更多推荐

 1
1 0
0- 0


 已为社区贡献1436条内容

所有评论(0)