
K-means聚类 —— matlab
1.简介2.算法原理3.实例分析3.1 读取数据3.2原理推导K均值过程3.3 自带kmeans函数求解过程完整代码
·
目录
1.简介
聚类是一个将数据集中在某些方面相似的数据成员进行分类组织的过程,聚类就是一种发现这种内在结构的技术,聚类技术经常被称为无监督学习。
K均值聚类是最著名的划分聚类算法,由于简洁和效率使得他成为所有聚类算法中最广泛使用的。给定一个数据点集合和需要的聚类数目K,K由用户指定,K均值算法根据某个距离函数反复把数据分入K个聚类中。
2.算法原理
K-means算法是典型的基于距离的聚类算法,采用距离作为相似性的评价指标,即认为两个对象的距离越近,其相似度就越大。该算法认为簇是由距离靠近的对象组成的,因此把得到紧凑且独立的簇作为最终目标。
K-mean算法步骤如下:
(1)随机选取K个样本为中⼼
(2)分别计算所有样本到随机选取的K个中⼼的距离
(3)样本离哪个中⼼近就被分到哪个中⼼
(4)计算各个中⼼样本的均值(最简单的⽅法就是求样本每个维度的平均值)作为新的中心
(5)重复(2)(3)(4)直到新的中⼼和原来的中⼼基本不变化的时候,算法结束
3.实例分析

数据来源于:统计年鉴
从数据中,我们可以看到,实际数据是被分为三类的。
3.1 读取数据
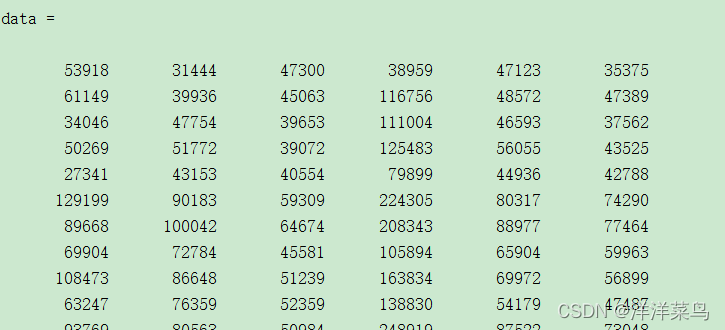
data=xlsread('D:\桌面\kmeans.xlsx')返回:

在这里我们看到,xlsread读取数据时没有读取变量名,但序号也被加进去了,接下来我们需要将其剔除
data=data(:,2:7)返回:
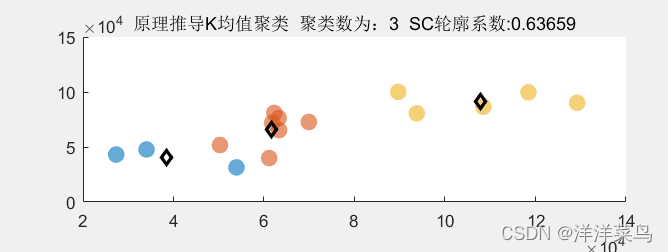
3.2 原理推导K均值过程
%% 原理推导K均值
[m,n]=size(data); %读取数据的行数与列数
cluster_num=3; %自定义分类数
cluster=data(randperm(m,cluster_num),:);
epoch_max=1000;%最大次数
therad_lim=0.001;%中心变化阈值
epoch_num=0;
while(epoch_num<epoch_max)
    epoch_num=epoch_num+1;
    for i=1:cluster_num
    distance=(data-repmat(cluster(i,:),m,1)).^2;
    distance1(:,i)=sqrt(sum(distance'));
    end
    [~,index_cluster]=min(distance1');
    for j=1:cluster_num
    cluster_new(j,:)=mean(data(find(index_cluster==j),:));
    end
    if (sqrt(sum((cluster_new-cluster).^2))>therad_lim)
        cluster=cluster_new;
    else
        break;
    end
end
%% 画出聚类效果
figure(2)
subplot(2,1,1)
a=unique(index_cluster); %找出分类出的个数
C=cell(1,length(a));
for i=1:length(a)
   C(1,i)={find(index_cluster==a(i))};
end
for j=1:cluster_num
    data_get=data(C{1,j},:);
    scatter(data_get(:,1),data_get(:,2),100,'filled','MarkerFaceAlpha',.6,'MarkerEdgeAlpha',.9);
    hold on
end
plot(cluster(:,1),cluster(:,2),'kd','LineWidth',2);
hold on
sc_t=mean(silhouette(data,index_cluster'));
title_str=['原理推导K均值聚类','  聚类数为:',num2str(cluster_num),'  SC轮廓系数:',num2str(sc_t)];
title(title_str)
返回:
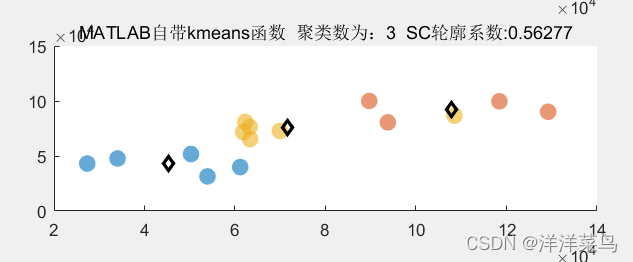
3.3 自带kmeans函数求解过程
%% MATLAB自带kmeans函数
subplot(2,1,2) %画子图,在这里是一图上可画两张子图
cluster_num=3; %自定义分类数
[index_km,center_km]=kmeans(data,cluster_num) ;%MATLAB自带kmeans函数
a=unique(index_km); %找出分类出的个数
C=cell(1,length(a));
for i=1:length(a)
   C(1,i)={find(index_km==a(i))};
end
for j=1:cluster_num
    data_get=data(C{1,j},:);
    scatter(data_get(:,1),data_get(:,2),100,'filled','MarkerFaceAlpha',.6,'MarkerEdgeAlpha',.9);
    hold on
end
plot(center_km(:,1),center_km(:,2),'kd','LineWidth',2);
hold on
sc_k=mean(silhouette(data,index_km));
title_str1=['MATLAB自带kmeans函数','  聚类数为:',num2str(cluster_num),'  SC轮廓系数:',num2str(sc_k)];
title(title_str1)
返回结果如下:
完整代码
clear;clc;
data=xlsread('D:\桌面\kmeans.xlsx')
data=data(:,2:7)
%% 原理推导K均值
[m,n]=size(data); %读取数据的行数与列数
cluster_num=3; %自定义分类数
cluster=data(randperm(m,cluster_num),:);
epoch_max=1000;%最大次数
therad_lim=0.001;%中心变化阈值
epoch_num=0;
while(epoch_num<epoch_max)
    epoch_num=epoch_num+1;
    for i=1:cluster_num
    distance=(data-repmat(cluster(i,:),m,1)).^2;
    distance1(:,i)=sqrt(sum(distance'));
    end
    [~,index_cluster]=min(distance1');
    for j=1:cluster_num
    cluster_new(j,:)=mean(data(find(index_cluster==j),:));
    end
    if (sqrt(sum((cluster_new-cluster).^2))>therad_lim)
        cluster=cluster_new;
    else
        break;
    end
end
%% 画出聚类效果
figure
subplot(2,1,1) %画子图,在这里是一图上可画两张子图
a=unique(index_cluster); %找出分类出的个数
C=cell(1,length(a));
for i=1:length(a)
   C(1,i)={find(index_cluster==a(i))};
end
for j=1:cluster_num
    data_get=data(C{1,j},:);
    scatter(data_get(:,1),data_get(:,2),100,'filled','MarkerFaceAlpha',.6,'MarkerEdgeAlpha',.9);
    hold on
end
plot(cluster(:,1),cluster(:,2),'kd','LineWidth',2);
hold on
sc_t=mean(silhouette(data,index_cluster'));
title_str=['原理推导K均值聚类','  聚类数为:',num2str(cluster_num),'  SC轮廓系数:',num2str(sc_t)];
title(title_str)

%% MATLAB自带kmeans函数
subplot(2,1,2) %画子图,在这里是一图上可画两张子图
cluster_num=3; %自定义分类数
[index_km,center_km]=kmeans(data,cluster_num) ;%MATLAB自带kmeans函数
a=unique(index_km); %找出分类出的个数
C=cell(1,length(a));
for i=1:length(a)
   C(1,i)={find(index_km==a(i))};
end
for j=1:cluster_num
    data_get=data(C{1,j},:);
    scatter(data_get(:,1),data_get(:,2),100,'filled','MarkerFaceAlpha',.6,'MarkerEdgeAlpha',.9);
    hold on
end
plot(center_km(:,1),center_km(:,2),'kd','LineWidth',2);
hold on
sc_k=mean(silhouette(data,index_km));
title_str1=['MATLAB自带kmeans函数','  聚类数为:',num2str(cluster_num),'  SC轮廓系数:',num2str(sc_k)];
title(title_str1)
返回:
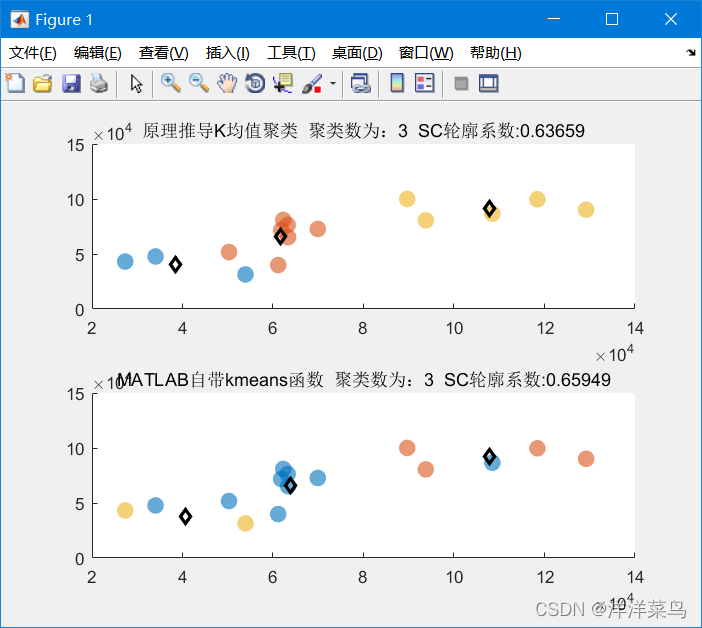
每次返回结果也不尽相同,原理推导的和自带的函数的求解结果也相差不是很大,但与原始数据的分类相比较,还是有一定差距

学大模型,用大模型上飞桨星河社区!每天8点V100G算力免费领!免费领取ERNIE 4.0 100w Token >>>
更多推荐


 72
72 1
1- 0


 已为社区贡献2条内容

所有评论(0)